Tissue Sampling
Using plant analysis as a nutrient management tool
Plant analysis is an excellent "quality control" tool for growers interested in high yield crop production. It can be especially valuable for managing secondary and micronutrients which don't have high quality, reliable soil tests available, and providing insight into how efficiently you are using applied nutrients.
There are two basic ways plant analysis can be used by Kansas farmers, monitoring nutrient levels at a common growth stage and for diagnostic purposes. Monitoring is generally done at a common growth stage, the beginning of reproductive growth, while diagnostics can be done any time.
Plant analysis for nutrient monitoring. For general monitoring or quality control purposes, plant leaves should be collected as the plant enters reproductive growth. Sampling under stress conditions for monitoring purposes can give misleading results, and is not recommended.
In corn , 15-20 ear leaves, or first leaf below and opposite the ear should be collected at random from the field at silk emergence, before pollination, and before the silks turning brown.
In sorghum , the first or second leaf below the flag leaf at heading should be collected. Again 15-20 individual leaves should be collected from the field at random.
In soybeans, the top, fully develop trifoliate leaflets should be collected when the first pods are 3/4 to one inch long. The top fully developed trifoliate leaflets are normally the third set of leaves below the terminal bud on the main stem of the plant. They should be a dark green, and will likely be positioned at the top of the canopy, while developing/growing leaves will be a lighter green color and generally be below the fully developed leaves in the canopy. Collect 25-30 sets of leaflets at random, removing the petiole, or stem connecting the leaflets to the stem.
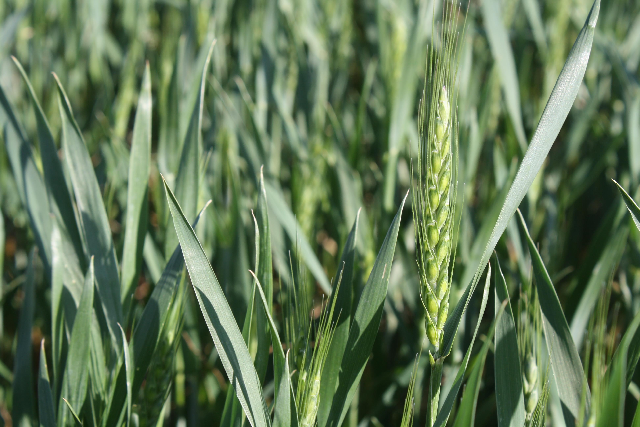
In wheat, the flag leaf is normally collected at heading. Since the flag leaves are small, 40-50 individual leaves will be needed to have enough dry plant material to have adequate plant material for analysis. Again, collect the leaves at random from the field or area which is being monitored.
Diagnostic sampling. Plant analysis is also an excellent diagnostic tool to help understand some of the variation seen in the field. When using plant analysis to diagnose field problems, try to take comparison samples from both good/normal areas of the field, and problem spots. Also, collect soil samples from the same good and bad areas since physical problems such as soil compaction often limits the uptake of nutrients present in adequate amounts. Don't wait for tasseling or silking to sample.
When sampling for diagnostic purposes, collecting specific plant parts is less important than obtaining comparison samples from good and bad areas of the field. As a rule of thumb, if plants are less than 12 inches tall, collect the whole plant, cut off at ground level. If above 12 inches, and until reproductive growth begins, collect the top fully developed leaves. Once reproductive growth starts, collect the same plant parts indicated for monitoring purposes.
When doing diagnostics, it is also helpful to collect a soil sample form both good and bad areas. Define your areas, and collect both soil and plant tissue from areas which represent good and bad areas of plant growth.
Shipping and handling plant samples. How do I handle samples, and where should I send the samples? The collected leaves should be allowed to wilt over night to remove excess moisture, placed in a paper bag or mailing envelope and shipped to a lab for analysis. Do not place the leaves in a plastic bag or other tightly sealed container, as they will begin to rot and decompose during transport, and the sample won't be usable. Most of the soil testing labs working in the region provide plant analysis services, including the K-State lab. Make sure to label things clearly for the lab.
What nutrients should you analyze for? In Kansas, nitrogen (N), phosphorus (P), potassium (K), sulfur (S), zinc (Zn), chloride (Cl) and iron (Fe) are the nutrients most likely to be deficient. Recently, questions have been raised by consultants and others concerning copper (Cu), manganese (Mn) and molybdenum (Mo). Most labs can analyze for most of these. Normally the best values are the "bundles" or "packages" of tests offered through many of the labs. They can be as simple as N, P, and K, or can be all of the 14 mineral elements considered essential to plants. K-State offers a package which includes N, P, K, Ca, Mg, S, Fe, Cu, Zn, and Mn for $20.
What will I get back from the lab? The data returned from the lab will be reported as the concentration of nutrient elements, or potentially toxic elements in the plants. Units reported will normally be in percent for the primary and secondary nutrients (N, P, K, Ca, Mg, S, and Cl) and ppm or parts per million, for the micronutrients (Zn, Cu, Fe, Mn, B, Mo, and Al). Most labs/agronomists compare plant nutrient concentrations to published sufficiency ranges. A sufficiency range is simply the range of concentrations normally found in healthy, productive plants during surveys. It can be thought of as the range of values optimum for plant growth. the medical profession uses a similar range of normal values to evaluate blood work. The sufficiency ranges change with plant age (generally being higher in young plants), vary between plant parts, and can differ between hybrids. So, a value slightly below the sufficiency range does not always mean the plant is deficient in that nutrient, but it is just an indication that the nutrient is relatively low. Values on the low end of the range are common in extremely high yielding crops. However, if that nutrient is significantly below the sufficiency range, then one should ask some serious questions about the availability and supply of that nutrient.
Keep in mind, also, that any plant stress (drought, heal, soil compaction, etc) can have a serious impact on nutrient uptake and plant tissue nutrient concentrations. So, a low value in the plant doesn't always mean the nutrient is low in the soil and the plant will respond to fertilizer, rather that the nutrient may not be available to the plant.
Levels above sufficiency can also indicate problems. High values might indicate over fertilization and luxury consumption of the nutrients. Plants will also sometimes try to compensate for a shortage of one nutrient by loading up on another. This occurs at time with nutrients such as iron, zinc, and manganese. Plants will load up on iron at times, in an attempt to compensate for low zinc. In some situations, very high levels of a required nutrient can lead to toxicity. Manganese is an example of an essential nutrient which can be toxic when present in excess. This can ocur at very low soil pH, generally well below 5.
The following table gives the range of nutrient contents considered to be "normal" or "sufficient" for corn at silking, soybeans at pod set, and wheat at heading. Keep in mind that these are the ranges normally found in healthy, productive crops.
| Nutrient | Units | Crop | ||
| Corn ear leaf at green silk | Soybeans top leaves pod set | Wheat flag leaf at boot to heading Nitrogen |
||
| Nitrogen | % | 2.75 - 3.50 | 4.25 - 5.50 | 3.4 - 4.5 |
| Phosphorus | % | 0.25 - 0.45 | 0.25 - 0.50 | 0.3 - 0.5 |
| Potassium | % | 1.75 - 2.25 | 1.70 - 2.50 | 2.0 - 3.0 |
| Calcium | % | 0.25 - 0.50 | 0.35- 2.00 | 0.3 - 0.5 |
| Magnesium | % | 0.16 - 0.60 | 0.26 - 1.00 | 0.2 - 0.6 |
| Sulfur | % | 0.15-1.50 | 0.15 - 0.50 | 0.15 - 0.55 |
| Chloride | % | 0.18 - 0.60 | - | 0.18 - 0.60 |
| Copper | ppm | 5 - 25 | 10 - 30 | 5 - 25 |
| Iron | ppm | 20 - 200 | 50 - 350 | 30 - 200 |
| Manganese | ppm | 20 - 150 | 20 - 100 | 20 - 150 |
| Zinc | ppm | 15 - 70 | 20 - 50 | 15 - 70 |
| Boron | ppm | 4.0 - 25 | 20 - 55 | 1.5 - 4.0 |
| Molybdenum | ppm | 0.1 - 3.0 | 1.0 - 5.0 | - |
| Aluminum | ppm | <200 | <200 | <200 |
| ppm | ||||
In summary, plant analysis is a good tool to monitor the effectiveness of your fertilizer and lime program, and a very effective diagnostic tool. Consider adding this to your toolbox.
-Dave Mengel, K-State Professor, Soil Fertility and Management